This time, I am interested in webscraping news headlines over some period of time for a given stock, and perform sentiment analysis to determine how positive those news are for a given stock. This can be useful for guiding me in decision-making for swing-trading. For instance, a positive sentiment score may suggest that the stock will be trading high. In that case, this gives me some idea on whether or not to hold it for a long period, or whether I should buy some shares, etc.
Similarly, I want to know if there might be some stocks that I don’t normally watch but could be having some positive outlook (e.g., additional funding provided to support covid-19 vaccine development for a healthcare company). So instead of analyzing the sentiment scores for a selected set of stocks, I scrape all the tickers within each/a certain sector, then I extract their news headlines and perform sentiment analysis across all the stocks. After that, I look into the top ~50 stocks I should pay special attention to – to first order, they have a higher chance of having surging in the next few hours or so!
BeautifulSoup versus Selenium
This time around, I used BeautifulSoup, and selenium and chromedriver to do the webscraping. In my previous posts, I have only used selenium. Both are very similar, but I find the former to be faster and does not rely on chromedriver. In the future, I think I will use BeautifulSoup more.
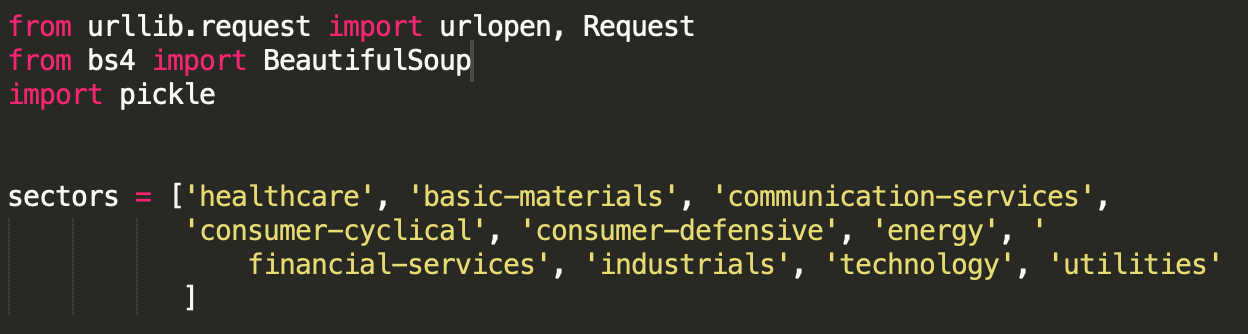
Here’s the list of sectors:
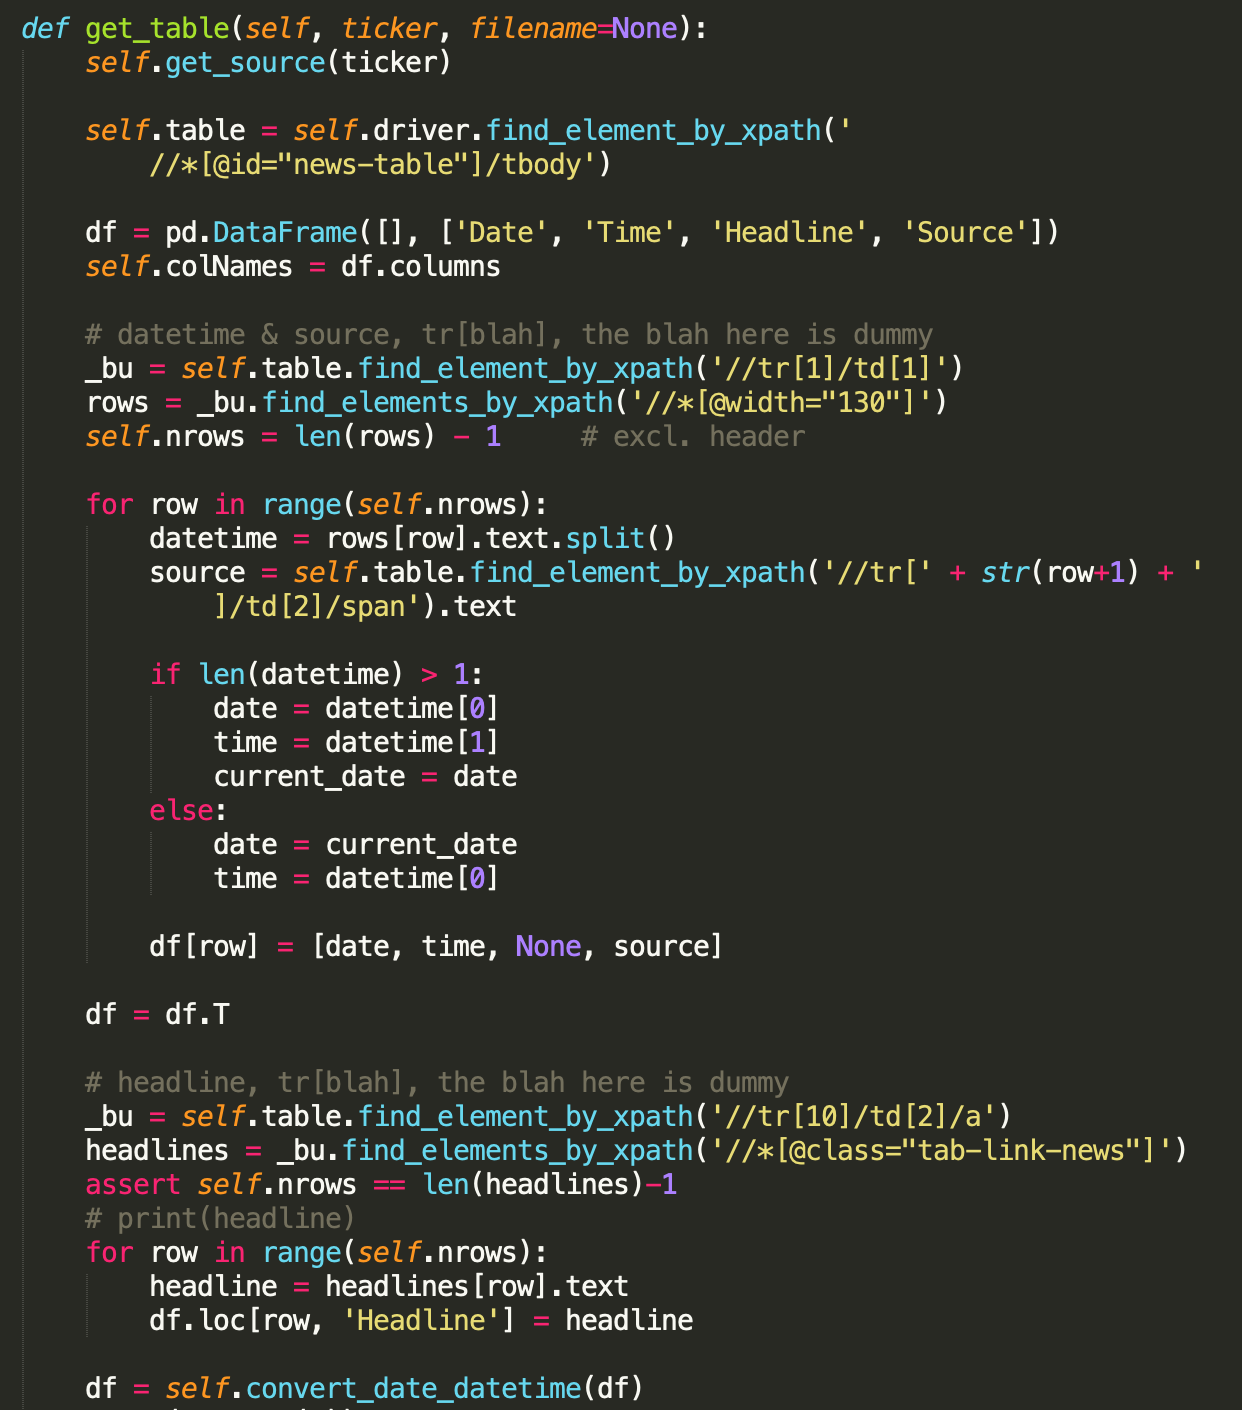
Using selenium to extract the news headline, the code looks like, which search for xpaths:
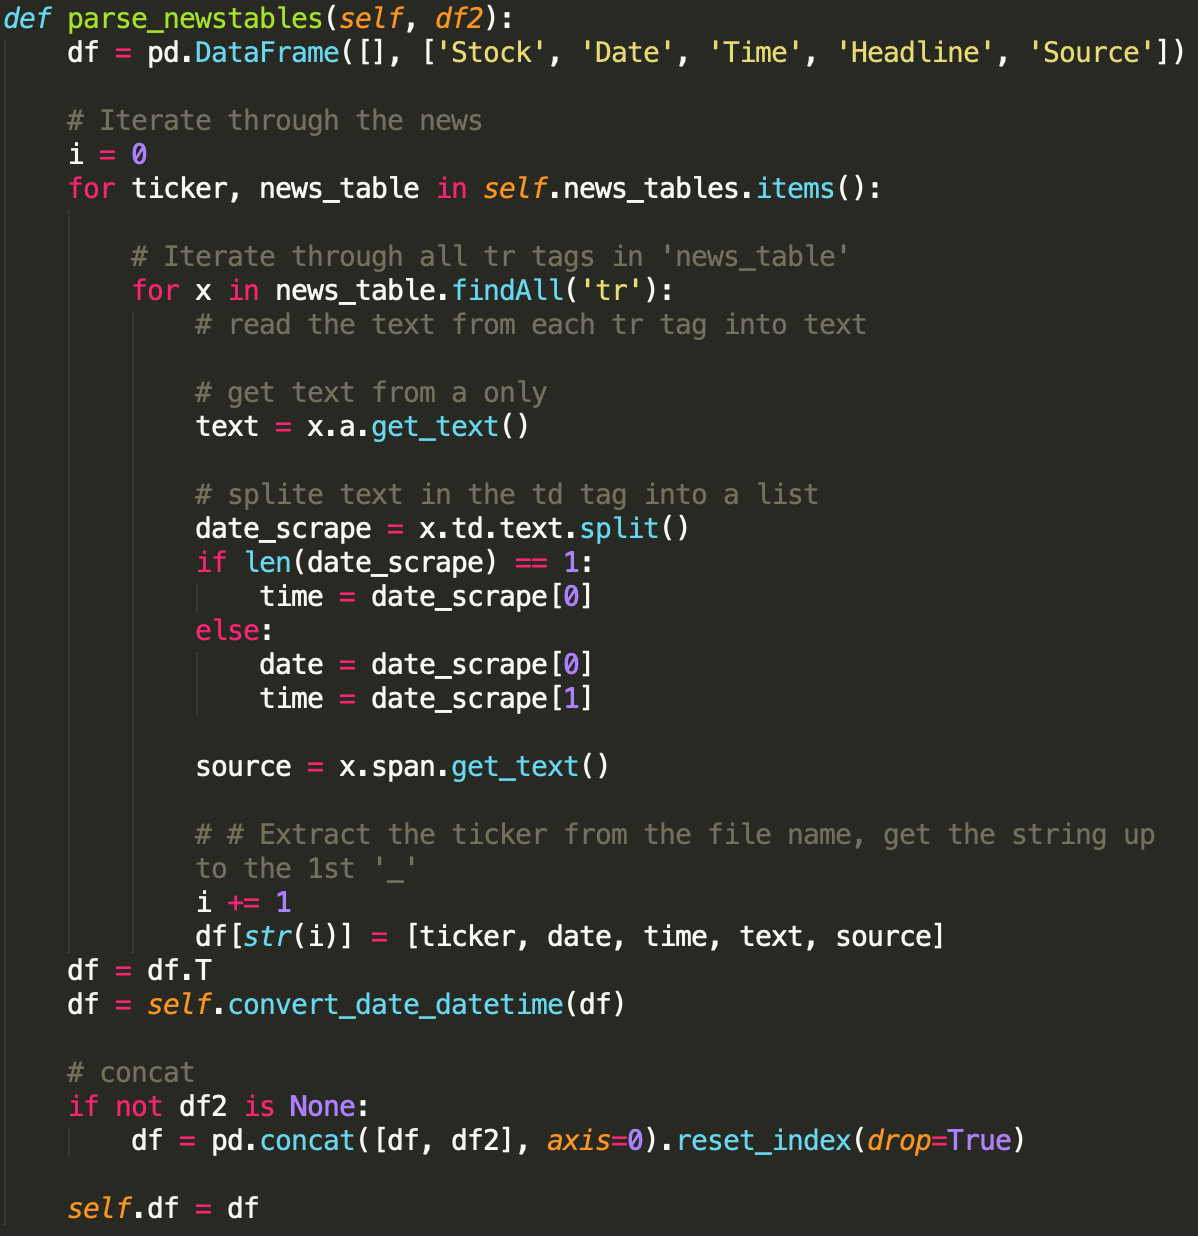
Using BeautifulSoup to parse the html code containing the news headline:
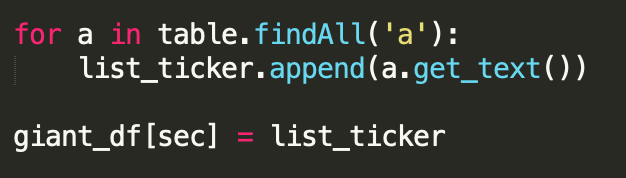
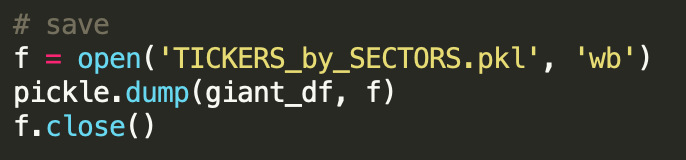
Since each sector contains a different number of stocks, I extracted the tickers in each sector using BeautifulSoup and put them into a dictionary and dump it into a pickle file.
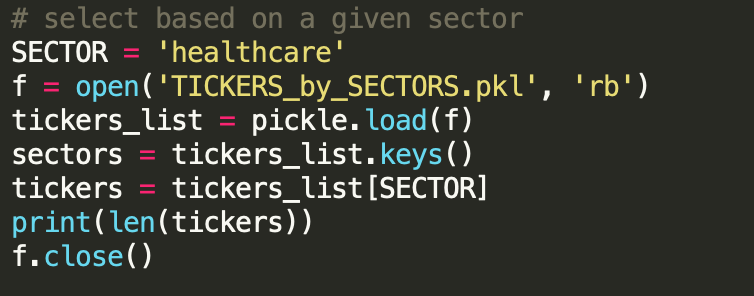
Subsequently, we read in the pickle file and load in the tickers of a given sector. In this time, I find the healthcare sector to have more “activities” as vaccine and cure for covid-19 are being developed.
EDA
As I parse the news headlines, I organize them into a dataframe containing 4 columns for each stock: date, time, news headline, and source. I keep the source of each news headline since some maybe more relevant, trust worthy, or the way they write their headlines may be more information/less subjective than others.
Currently, I am using out-of-the-box TextBlob and nltk VADER to perform sentiment analysis. With TextBlob, we get a polarity and a subjectivity metric, the latter allows us to weight the polarity score/decide on whether or not to trust it. A lower score means less subjective. nltk VADER is also a lexicon, rule-based sentiment analysis (unsupervised) tool, which is attuned to sentiments expressed in social media.
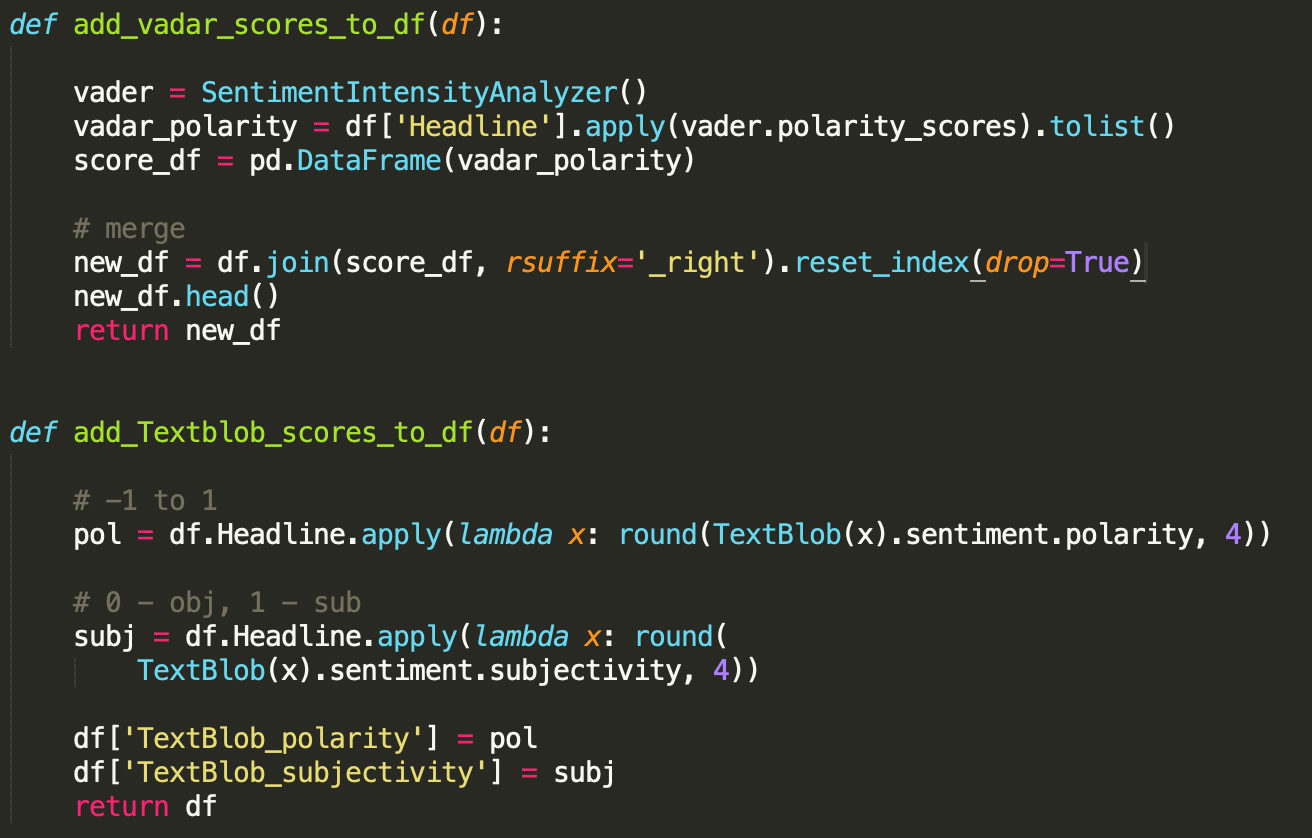
With the sentiment scores from TextBlob and VADER, I have 6 additional columns: neg, neu, pos, compound, polarity, subjectivitiy, which are used to perform inferential analysis.
Few words on current ad-hoc sentiment analysis
None of these out-of-box sentiment is suitable for my purpose. I should train a supervised machine learning model on some labeled data. For instance, I’d label past data/new headlines based on whether or not it leads to increased in stock price that day, next 3-days, next 5 days? I will then be able to benchmark my model/sentiment scores based on the accuracy. However, this is to be implemented when I have a bit more time in the next few days or so.
Plots
Assuming for now that the sentiment scores are reliable. We can visualize/compare trends of stock sentiments, and find relation to stock prices. We obtain the stock prices using yahoo finance’s API yfinance.
There are a few things I want to expand/work on to make it more useful, including what I said about sentiment analysis ML model building above. I will report some metrics and include plots in a future post.