Color-code the number of confirmed Covid-19 cases by county in USA
I am curious on the time evolution of the confirmed Covid-19 cases in each county across US. Of course, such map is probably posted somewhere on the internet but I’d like to do it for myself as an exercise. By writing my own script, I can generate the map using the latest data wheneven I want to instead of waiting for someone to update their maps, and I can plot with a color scheme or color scale of my choice.
To do so, we will need the latest number on the confirmaed cases in each county. Fortunately, this has been compiled by USAFacts. We will read this in as a pandas DataFrame. To map the number in each county, we will make use of the Federal information processing standard (FIPS) code, which is a unique 5 digit code for each county.
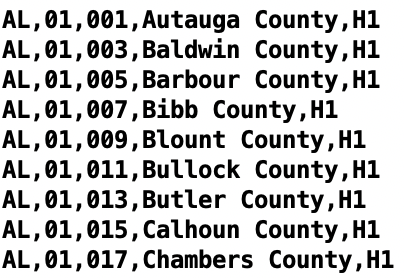
Some FIPS code begins with leading zeros, thus, we want to keep them:

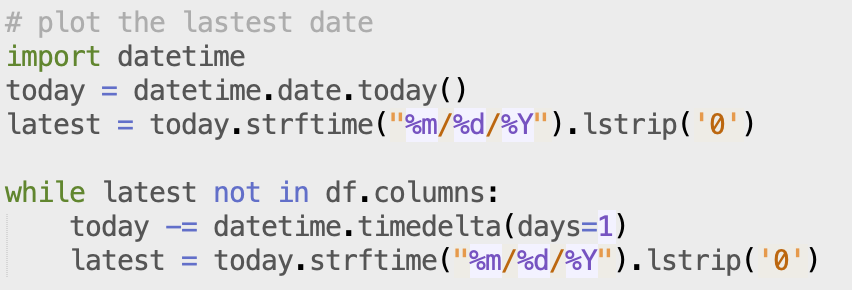
Since I’m interested in the most recent data, I want to look into the column that corresponds to (ideally) today. If data for today does not exist, we will loop for the previous day:
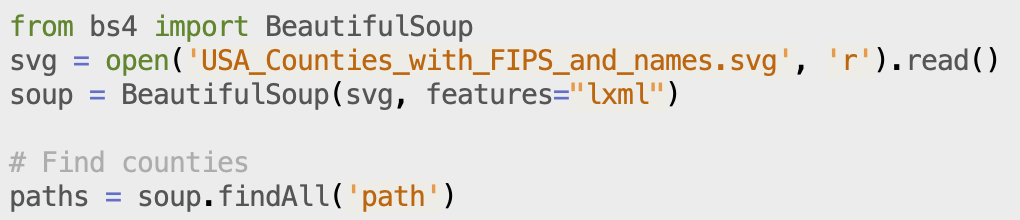
To distribute the number of cases across a map, I downloaded a .svg file that contains the boundaries and the FIPS code for each county. Then, we use BeautifulSoup to parse the .svg file as XML structure.
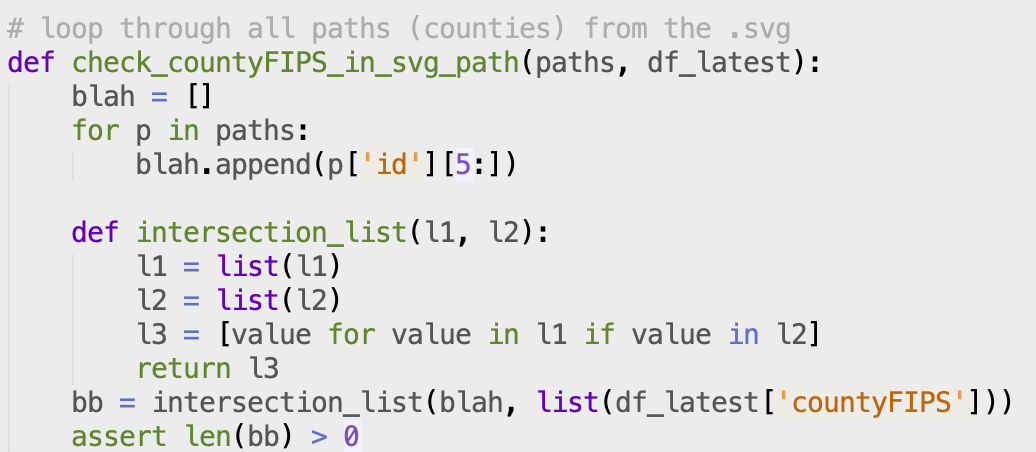
For sanity, we want to make sure that the FIPS code we read corresponds to a county can be found in the .svg file. This is very useful (and even potentially crucial) because the FIPS column in the pandas DataFrame may be saved in a different datatype than the BeautifulSoup web element FIPS found in path id. In that case, we wouldn’t be able to find a matching row from the pandas DataFrame, even if the same FIPS exist in both the pandas DataFrame and the .svg file. To check this, we will convert the pandas FIPS column to a list and create a list of FIPS from the BeautifulSoup object, and use python list apprehension.
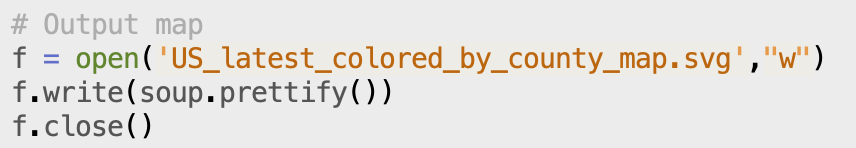
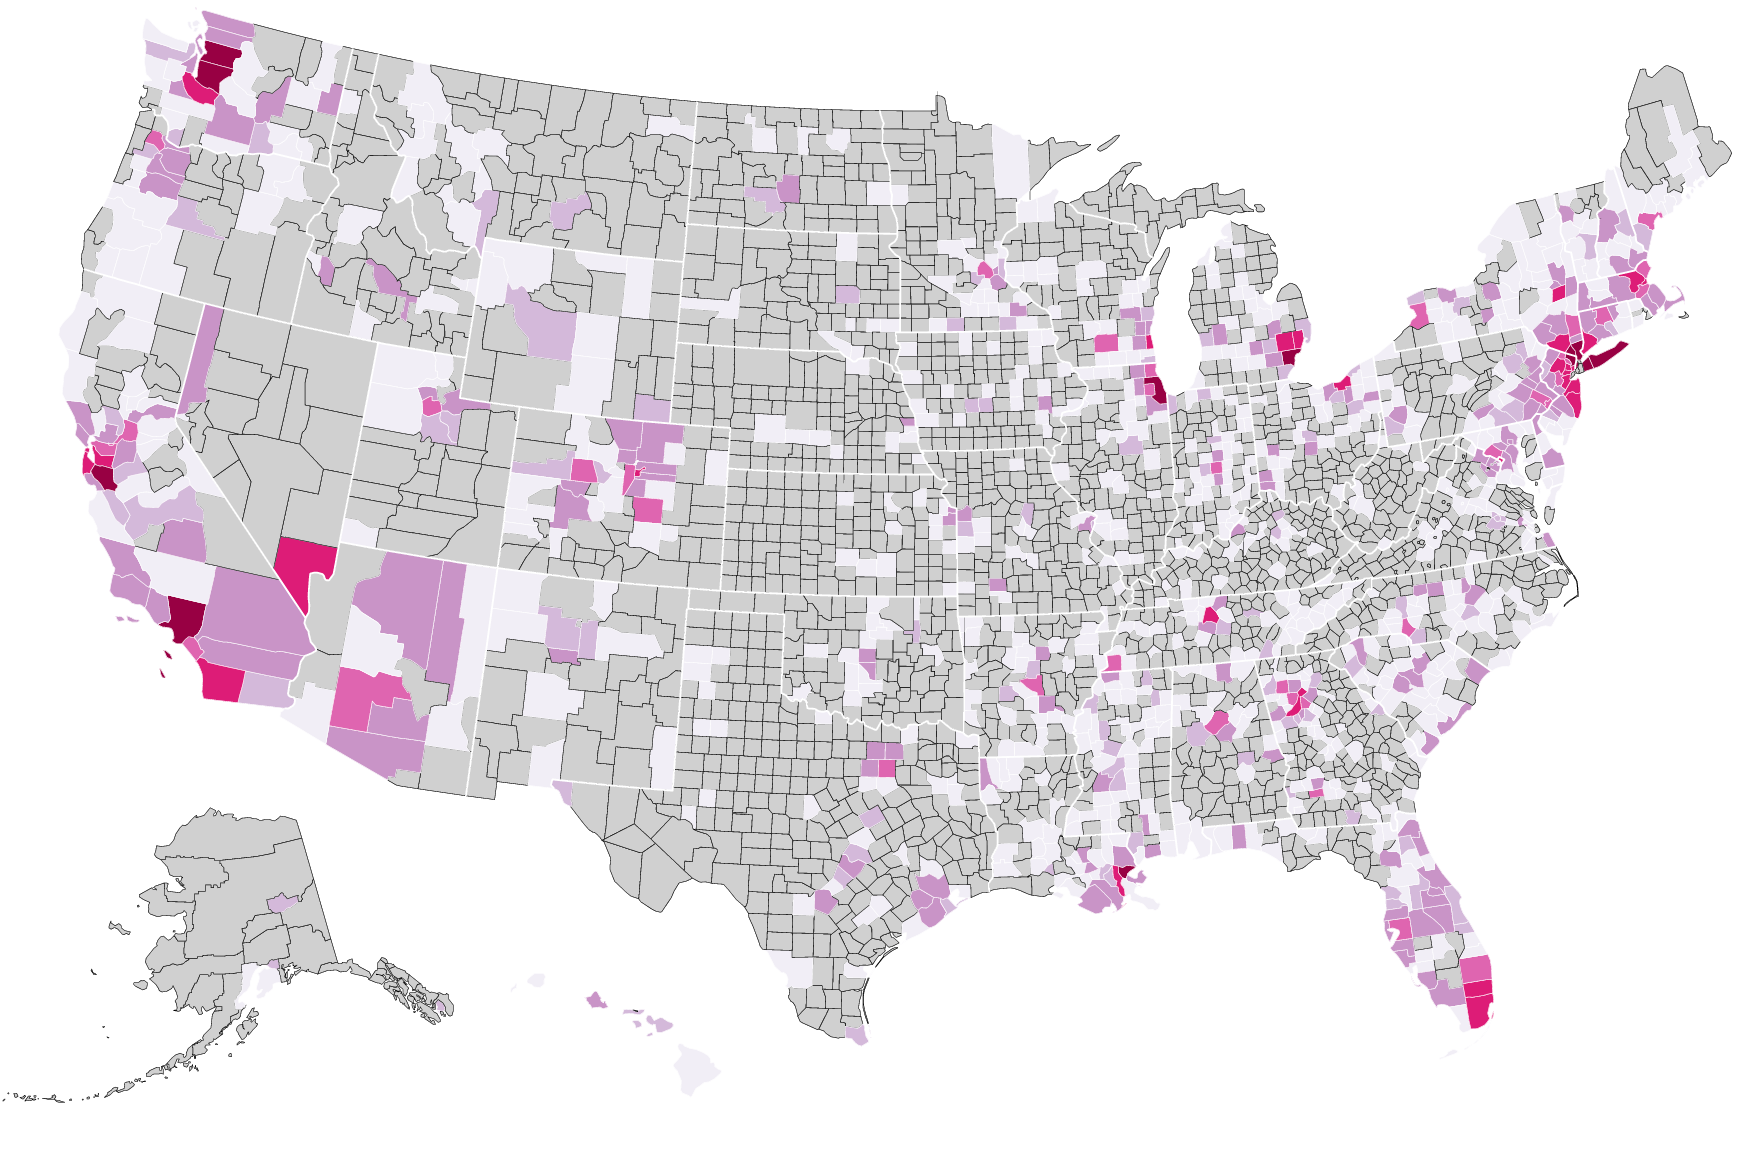
We will then loop through each paths found in the .svg file and update the style with a fill color depending on the number of confirmed cases in that county. Here’s the final product, which is saved in .svg format in the code but is converted into .png for this article.